Quick Start Guide
Learn how to turn complex math concepts into clear, publisher-ready diagrams in seconds.
Sign In or Create Account
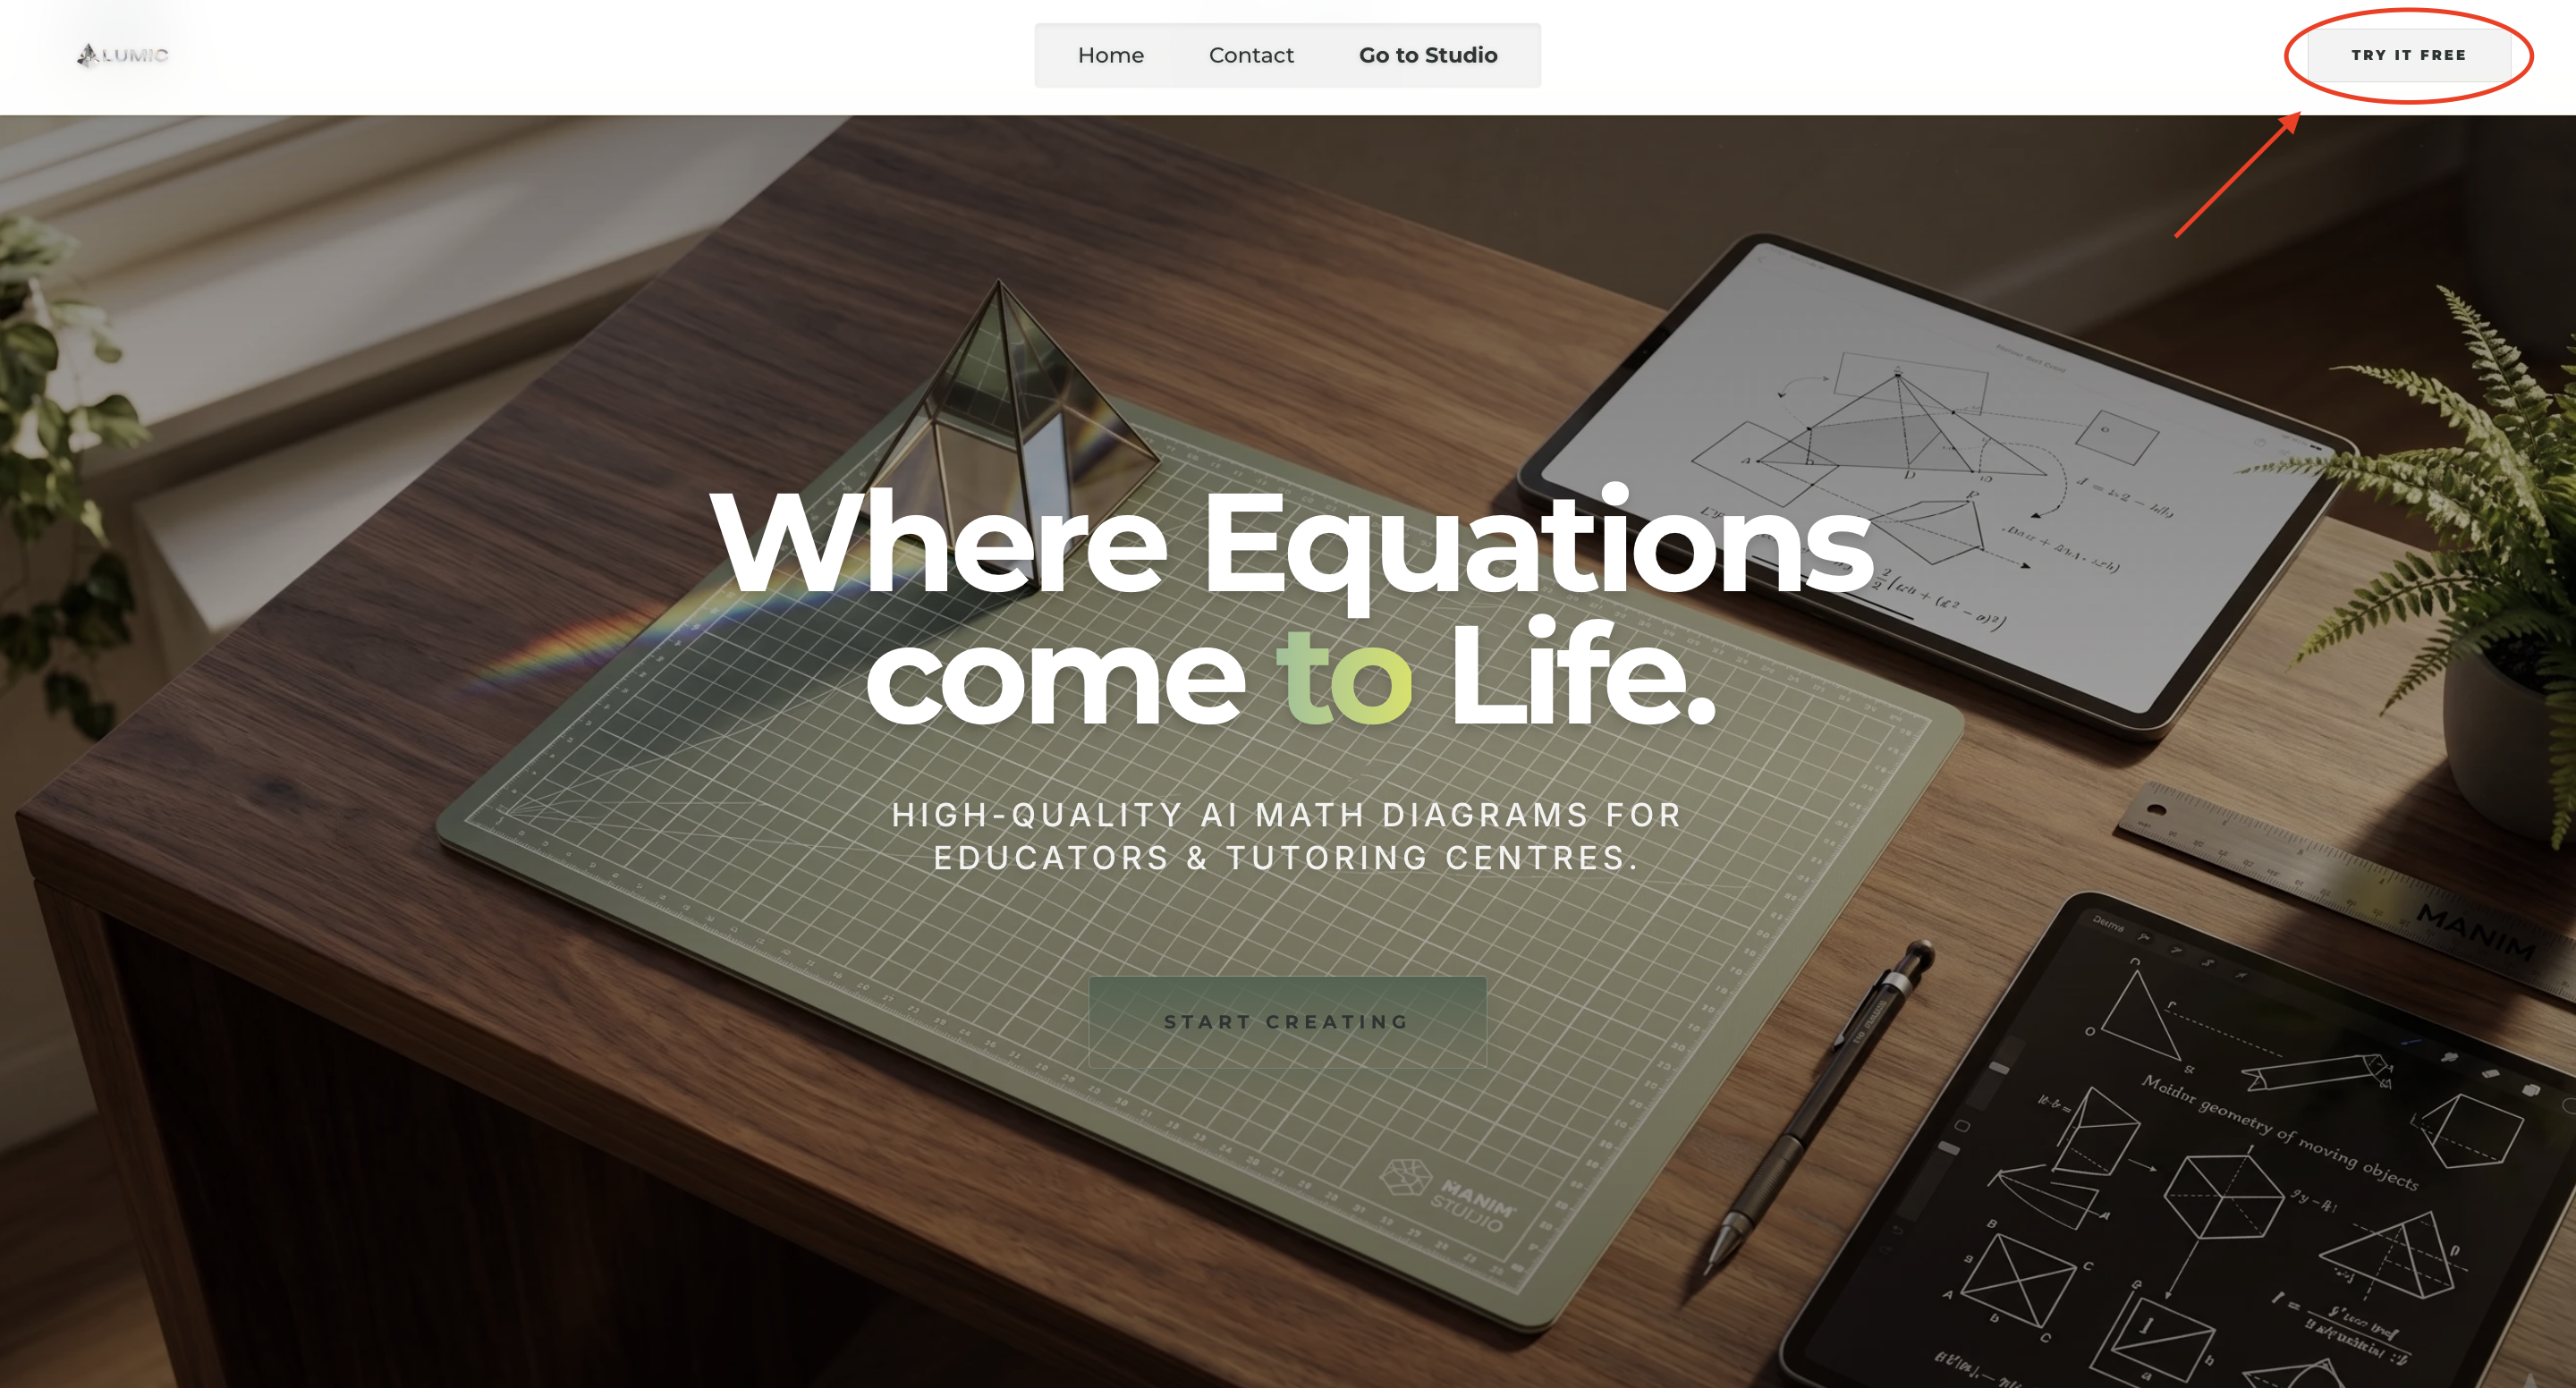
Before generating diagrams, you need an active LUMIC account.
- check_circleClick the User Icon in the top right, or click any "Start Creating" button on the homepage.
- check_circleSign in using your Google account or email address.
- check_circleOnce authenticated, you will be redirected back to the platform.
Insert Sign-In Screenshot
Insert Studio Screenshot
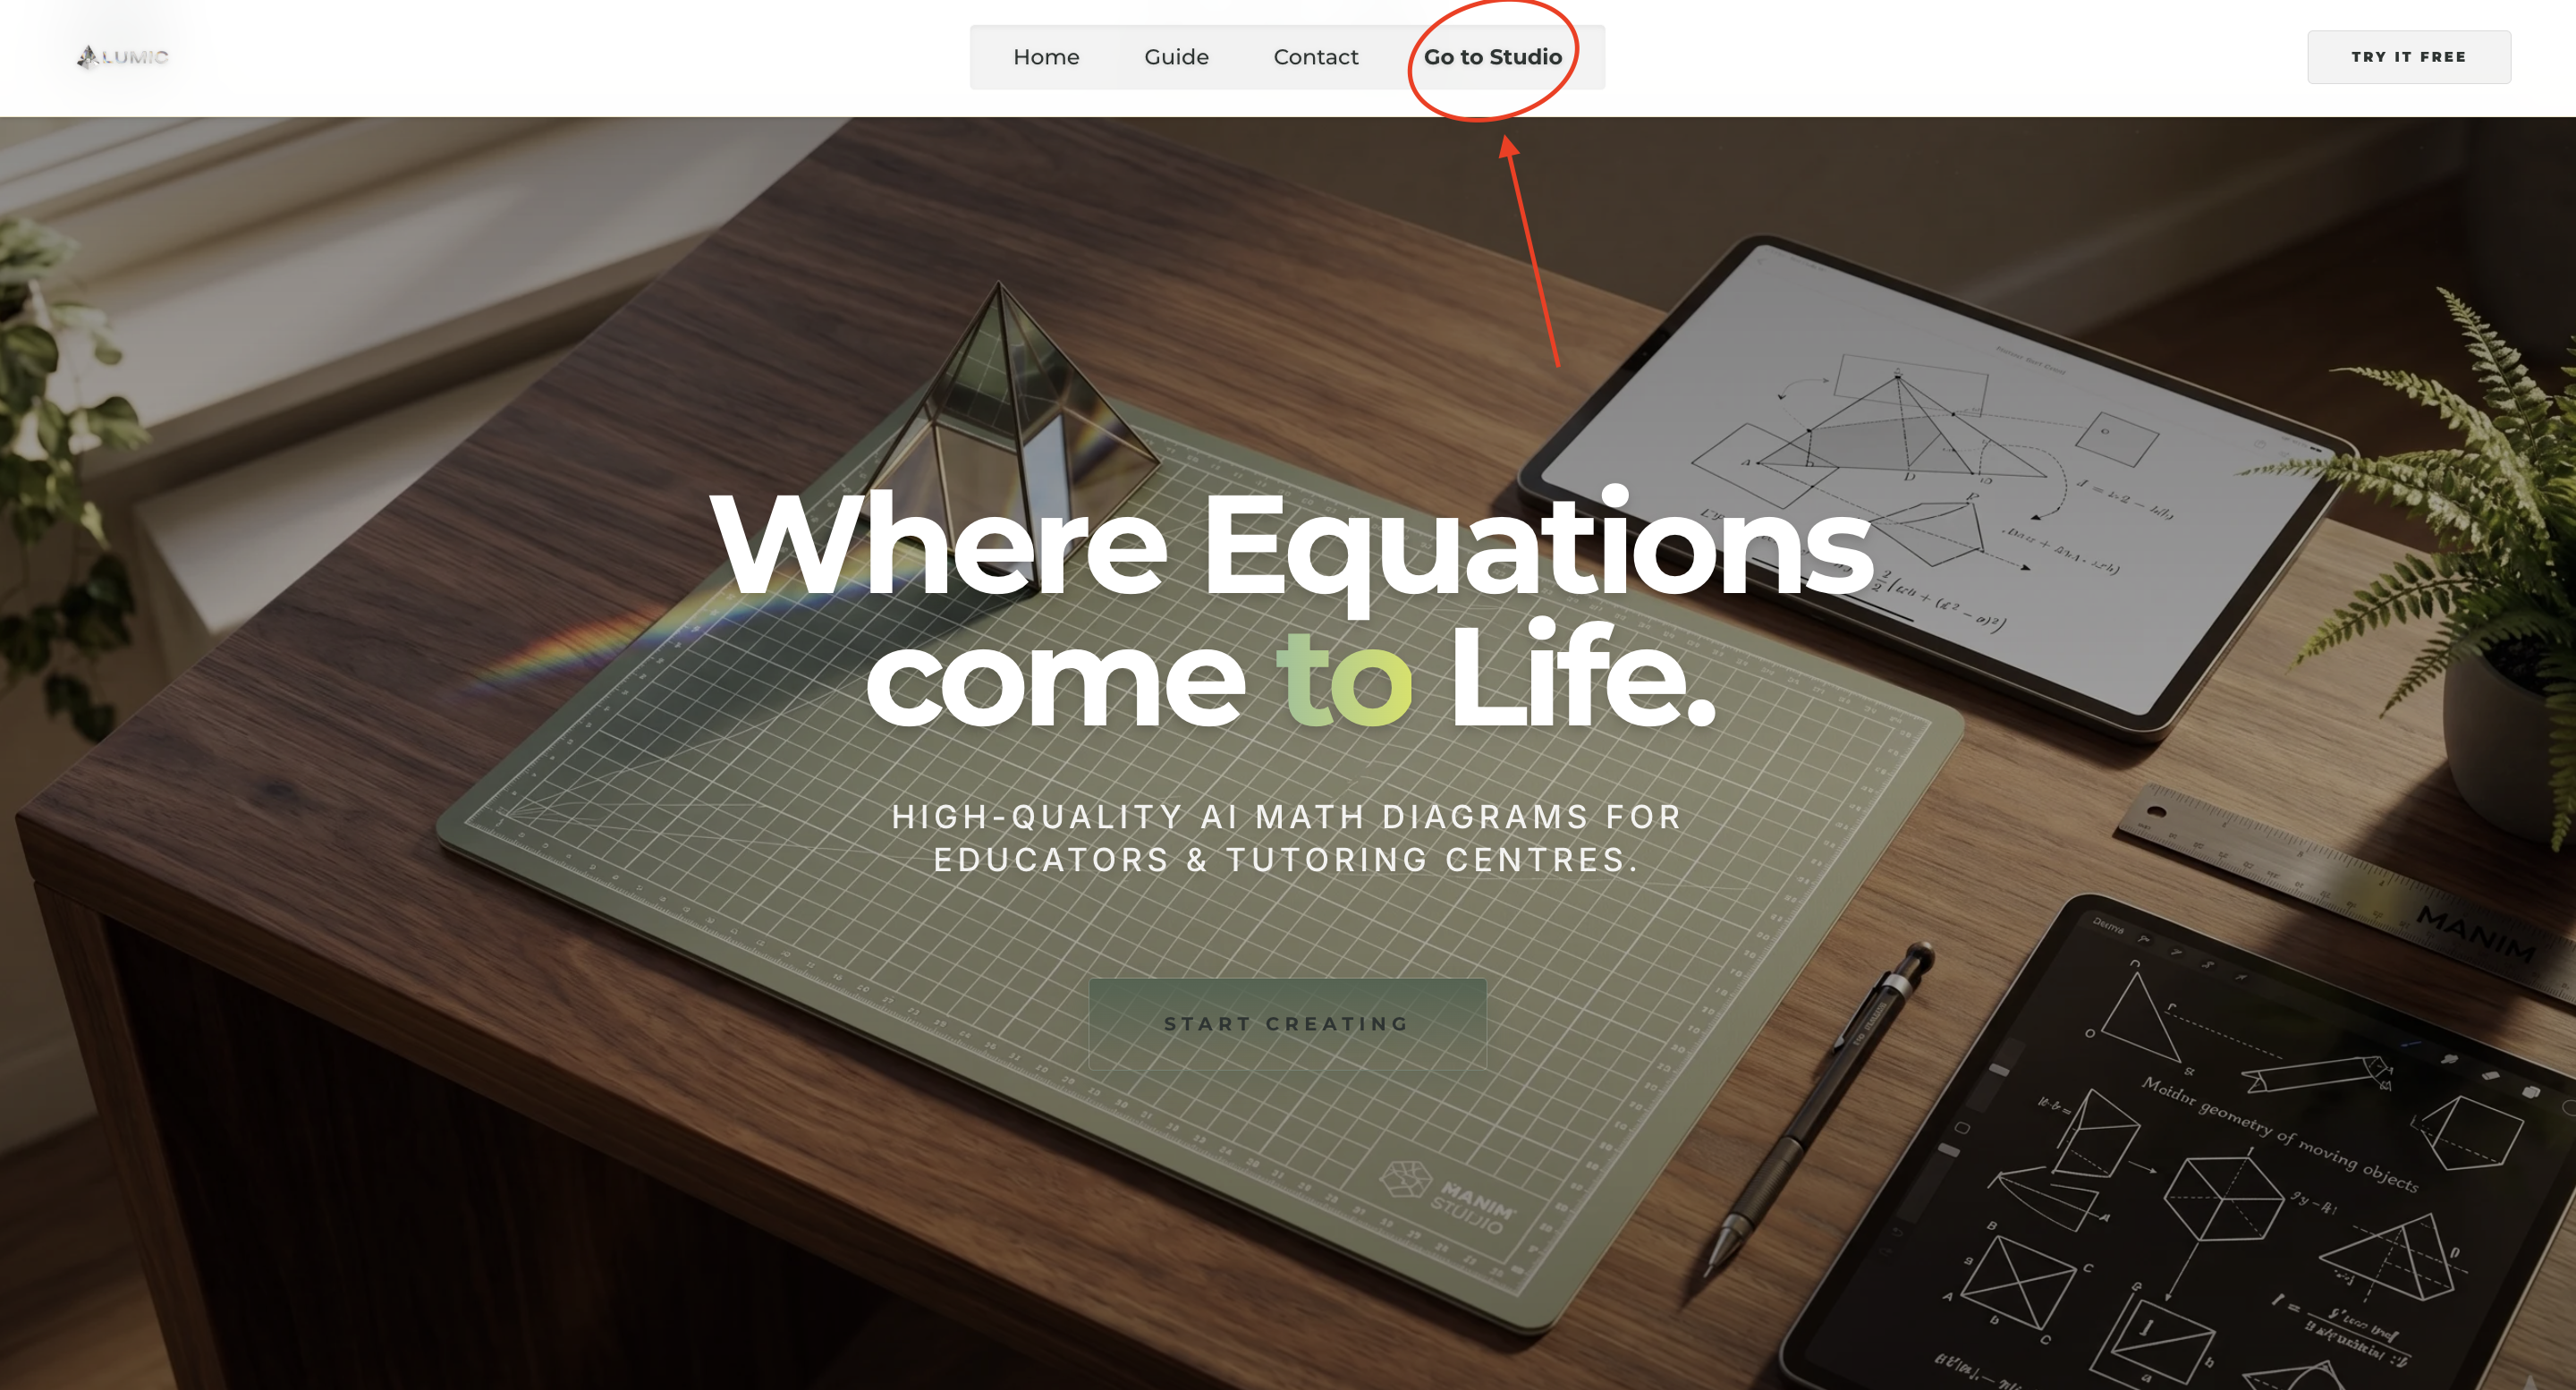
Accessing the Studio
The Studio is your primary workspace for generating visuals.
- check_circleClick the Studio link in the navigation header.
- check_circleYou will need generation credits to create diagrams. Check your PRO and FAST credit balances in the top right of the Studio.
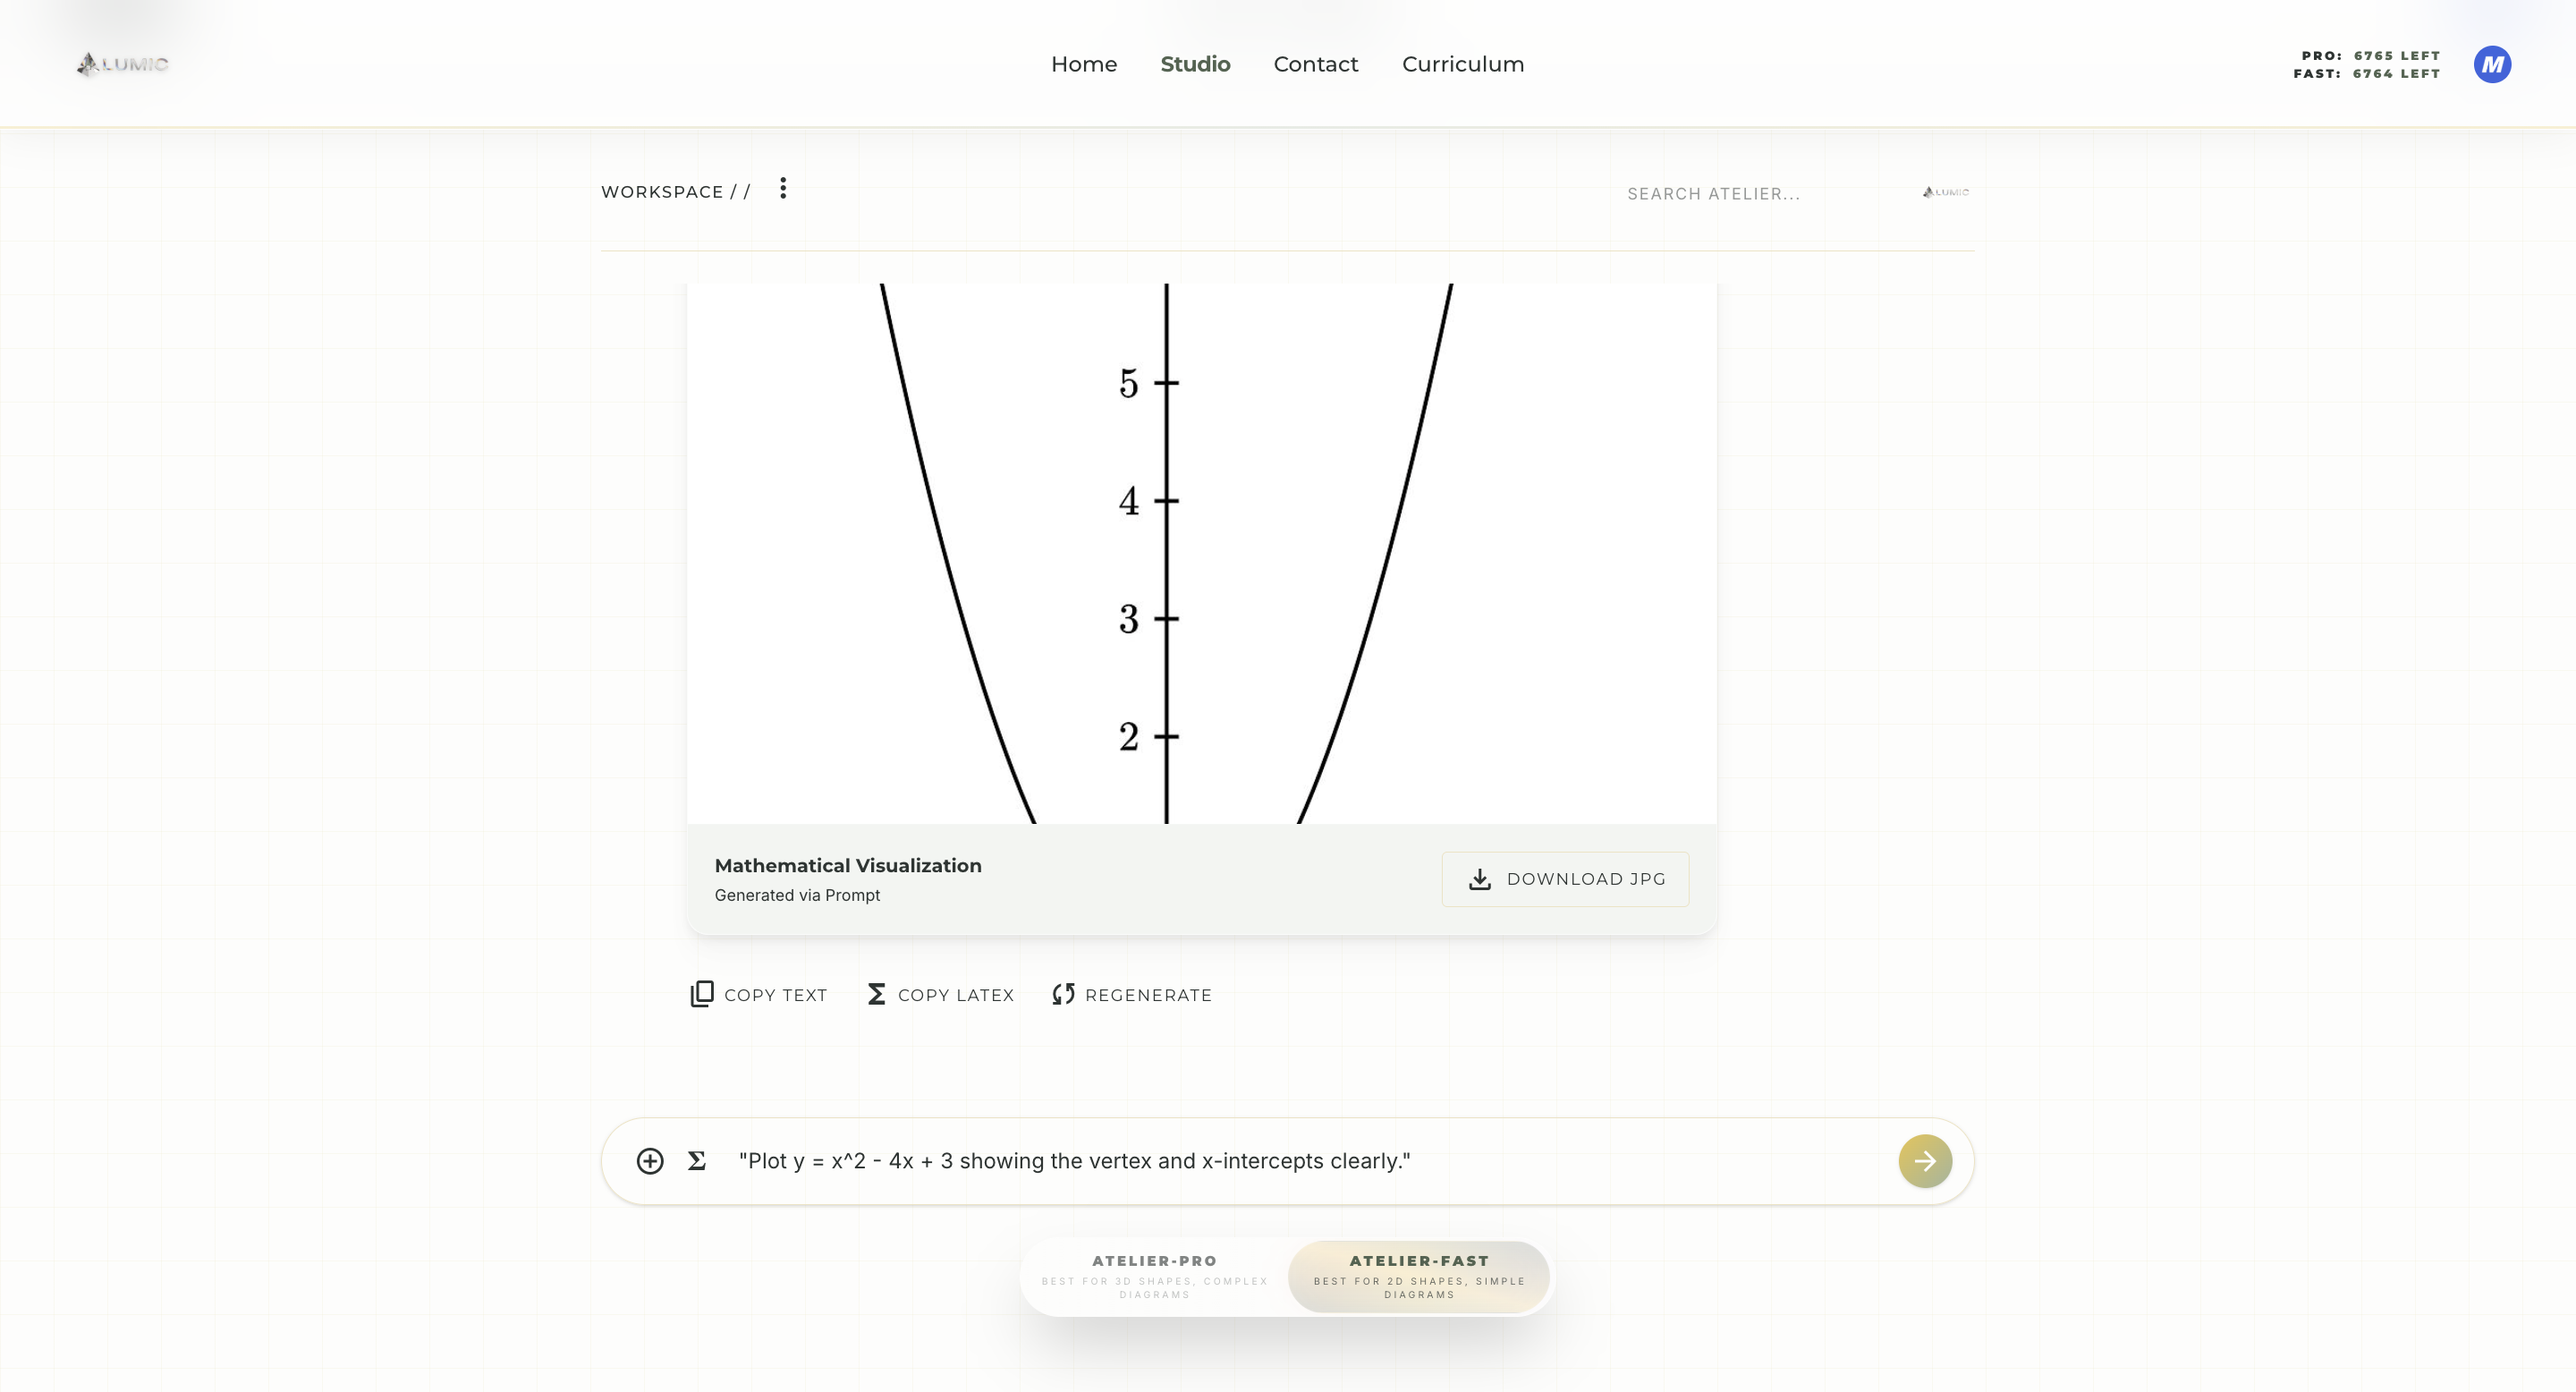
Prompting for Diagrams
In the Studio, you'll see a chat interface. This is where you describe the diagram you need. LUMIC works best when you provide clear, specific mathematical parameters.
Example Prompts
- "Draw a standard normal distribution curve shading the area z > 1.96"
- "Plot y = x^2 - 4x + 3 showing the vertex and x-intercepts clearly."
Insert Prompting Screenshot
Insert Generation Screenshot
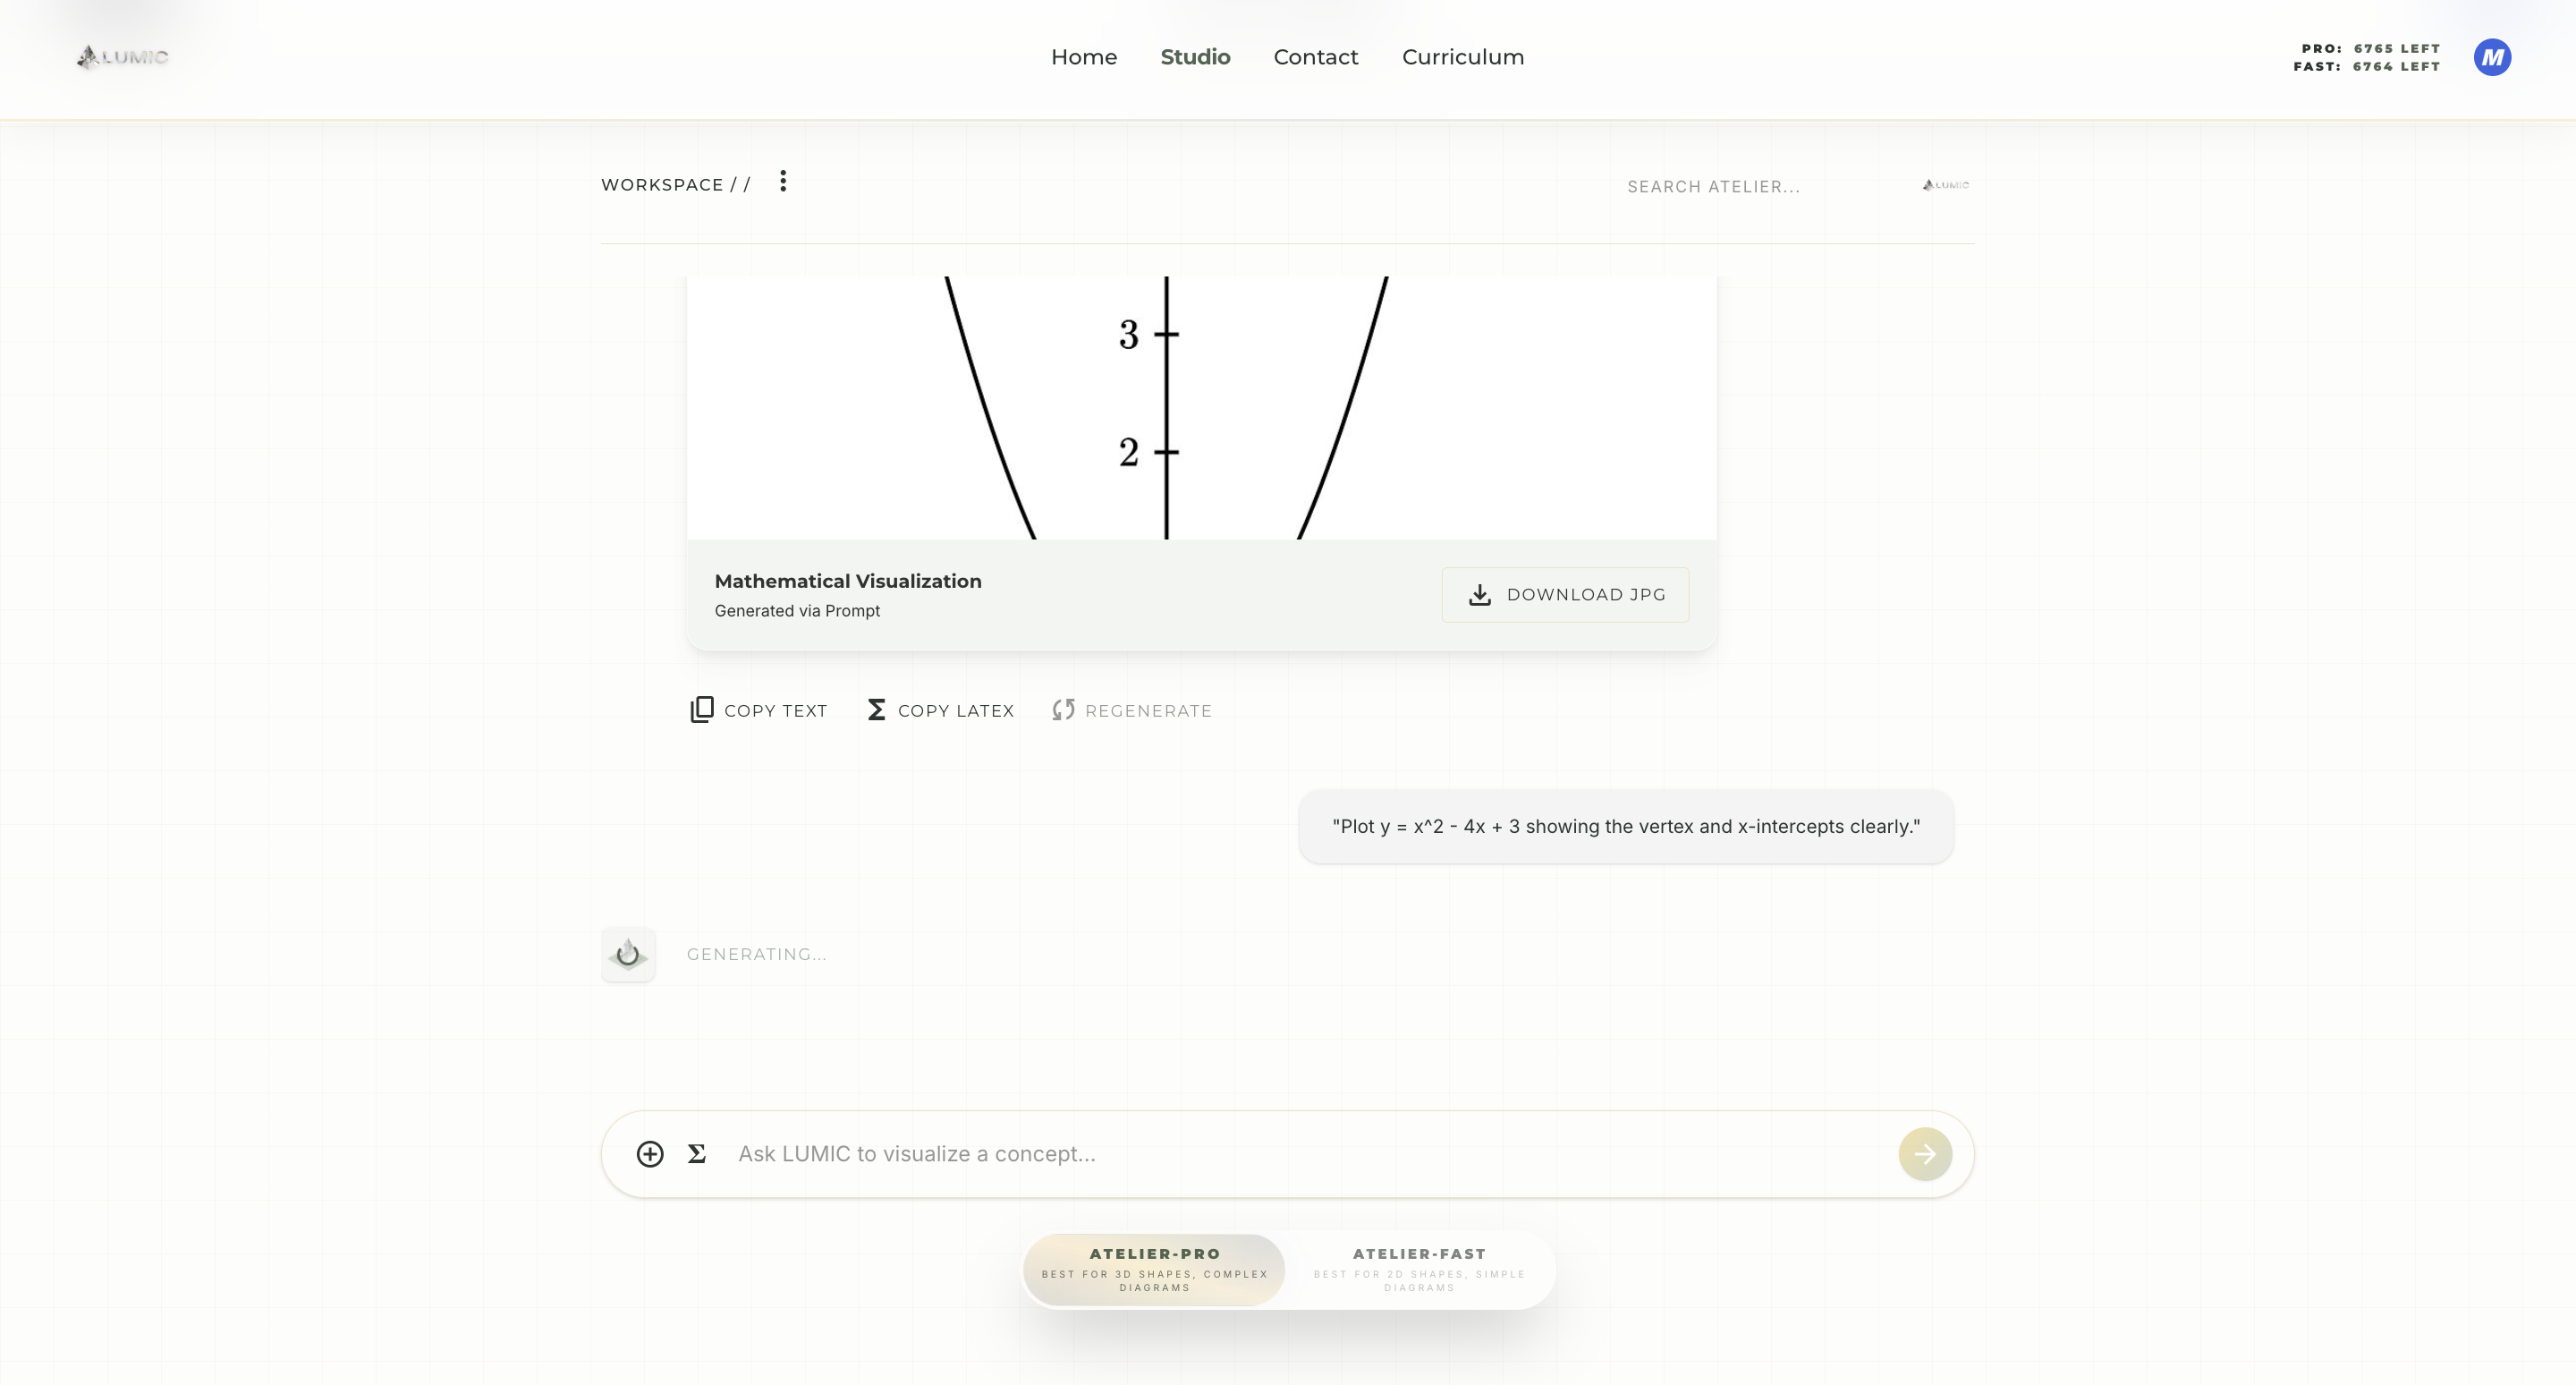
The Generation Process
Once you send your prompt, LUMIC's AI engine will start crafting your visual.
- check_circleThe process usually takes 10–20 seconds for standard diagrams.
- check_circleWhen finished, the diagram will appear directly in the chat feed.
- check_circleIf it's not quite right, you can use the Regenerate functions or simply type a follow-up message to tweak it.
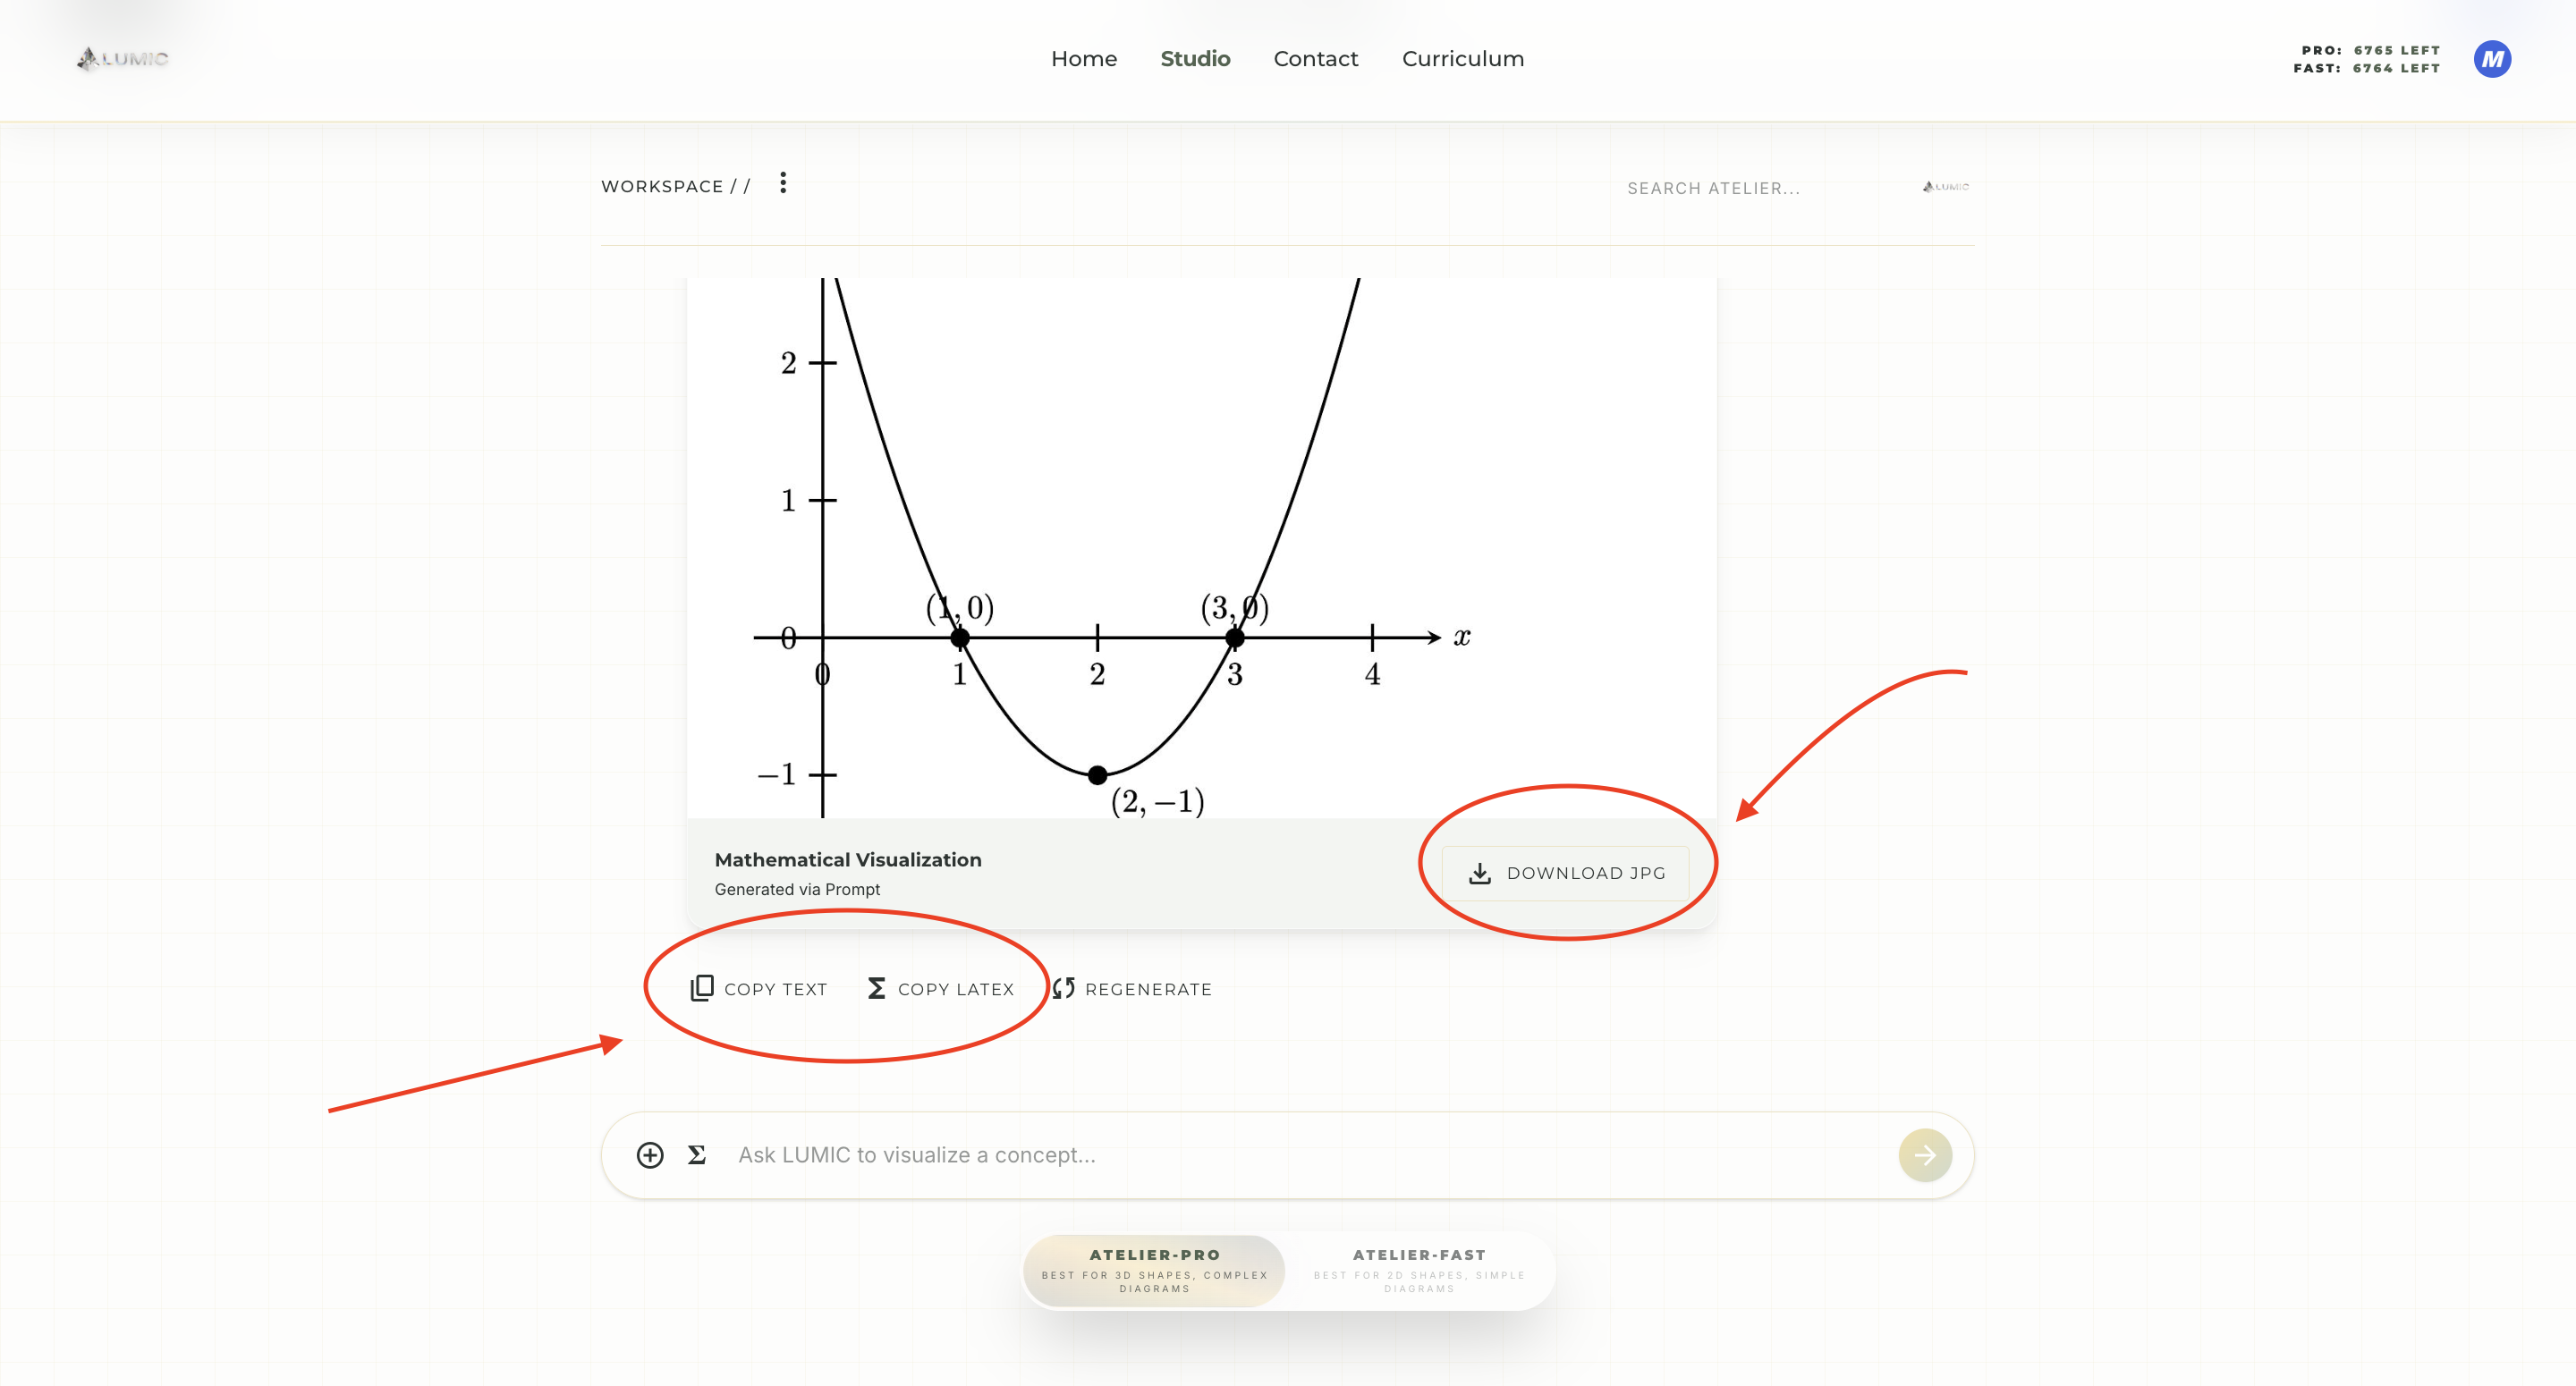
Exporting & Using
Your diagrams are ready to be used in your worksheets, presentations, or exams.
Download JPG
You can easily download your diagrams as high-resolution JPG images, perfect for inserting into Word documents, Google Docs, or PowerPoint.
Copy Code
Need the raw formatting? You can copy the generated plaintext or LaTeX code directly to your clipboard for use in math typesetting environments.
Insert Export Screenshot